Statistical Software & Traffic Forecasting
Posted 04/11/2020 by Sara Tawil

Traffic forecasting is an essential step in planning an infrastructure project as it helps businesses optimise resources catered to demand-driven growth. This practice, however, relies on many factors which include the tools traffic advisors use to analyse traffic and socioeconomic data in order to produce the most accurate predictive models possible.
Microsoft Excel, which includes a statistical package, has an intuitive and practical user interface, however it lacks the statistical power of more specialised software such as R and Stata. These may be less user-friendly in the sense that a little knowledge of coding is involved but have several advantages that make causal inference easier and more precise. Whilst traffic forecasting series are not always very “long” and the data sets not as large as in other fields, statistical software allow the users a much greater flexibility in working with the data set. For example, in Excel, the presentation of variables needs to be in consecutive columns whereas in R or Stata all variables are stored as separate arrays that can be easily added or removed from regressions by modifying a line of code.
If one’s aim is to simply run a regression of traffic on Gross Domestic Product (GDP) and a dummy variable to control for, say, the Global Financial Crisis, then going through the extra time needed to develop a script of code would be tedious and unnecessary. However, when running more complex analysis, with multiple explanatory variables, control dummies, de-seasonalisation trends, etc. the use of purpose developed statistical packages amply justify the time spent scripting the models tested. At Infrata, projects vary in level of complexity, , and experience different growth trends and idiosyncratic consumer patterns derivative from specific socioeconomic drivers. Such projects require consultants to think critically about how to model traffic levels by carefully selecting logical explanatory variables, controls, specific timelines representative of organic growth, and the frequency of the data at hand (monthly, quarterly, annually). Using R, as an example, allows us to easily optimise our selection of variables, timelines, and frequencies in order to get model specifications which are intuitively logical and with the best fit possible.
When working with seasonal data, regression variables must be de-seasonalised to measure their true underlying trend. Often, this is done in Excel by adding ‘seasonal dummies’ that may reduce the explanatory power of other and more important drivers of growth. Statistical software allows the user to de-seasonalise the main economic drivers as well as historical traffic (or passengers) levels and run regressions based on real trends. The resulting models provide a truer relationship of the dependent to independent variable, without distorting the analysis with dummy variables. Using quarterly or monthly data is very advantageous when dealing with immature infrastructure projects that have a shallow number of annual observations (which often is the case in LDCs and road projects) as it increases the number of total historical observations for traffic variables and improves the strength of the regression at a global scale.
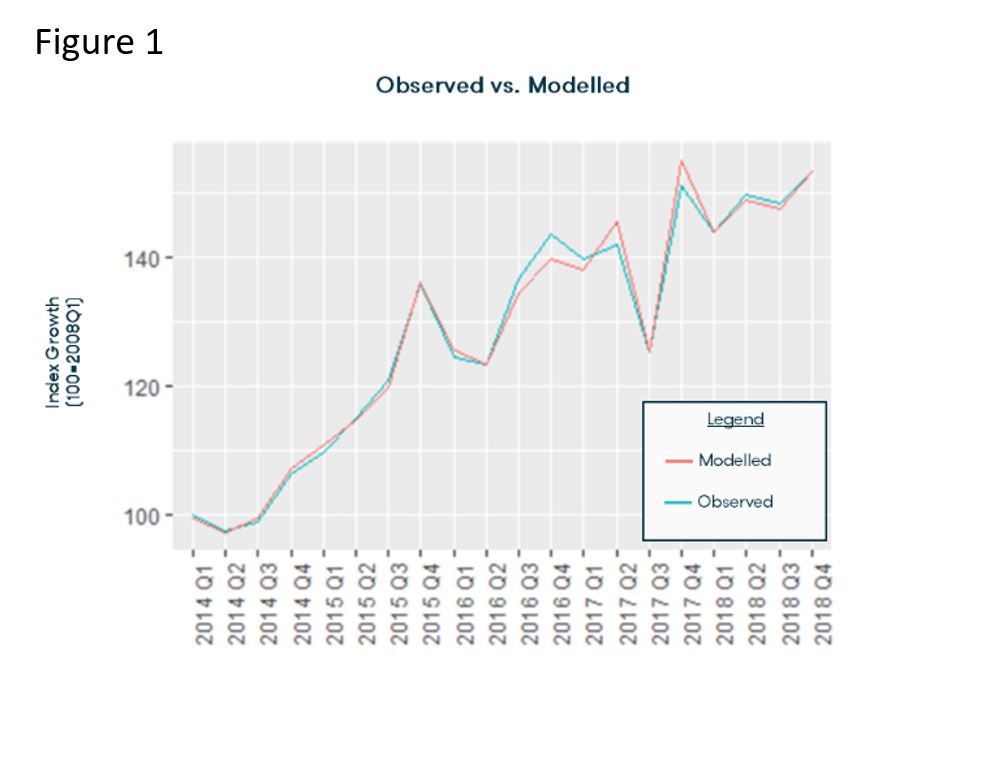
This is seen when running several statistical tests on the ‘goodness’ of the selected regression at estimating the historical fit which can be investigated by graphing the modelled estimates versus those observed in the past i.e. a back-forecast or backcast (figure 1) as well as looking at certain test statistics (F-test, Chi-square, t-tests) versus a certain threshold. Testing the fit of the model via graphs is a few lines of code in R or Stata but more tedious selection of menu items, organisation of spreadsheet variables, and the actual calculation of modelled estimates in Excel - the ease in which R allows us to graph back-forecasts and view test statistics is crucial when time at hand is limited.
When dealing with data that is split into different categories, for example several airport terminals, regional destinations, toll plazas, vehicle types etc., we have noticed that often models implemented by running a regression for each category. Whilst, in some cases this may be reasonable as each category is driven by specific drivers of growth, in many other cases, the fundamental relationship between dependent and independent variable is not different between 2 different categories (eg 2 toll plazas in a homogeneous highway section).
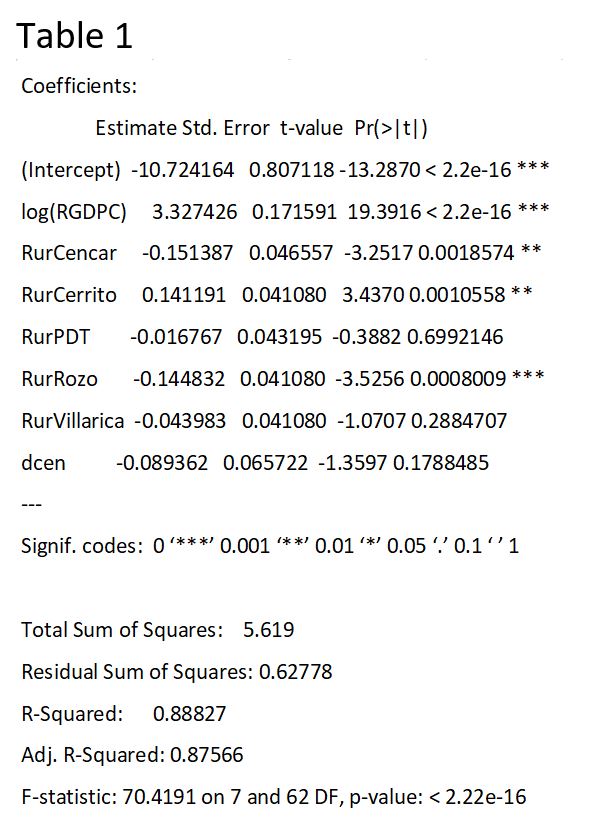
This modelling inefficiency, can be mitigated in R or Stata by using what is known as a panel regression. So, instead of running 18 regressions for say cars, buses, and trucks at 6 different toll plazas on GDP; R would allow traffic modellers to run 3 regressions on GDP for each toll category split into 6 different panels. More elaborately, the regression output would present the results as an overall elasticity to GDP of total traffic for the specific vehicle category and then create a panel differential for each of the toll plazas’ relative percentage difference from the overall traffic elasticity (as seen in table 1). This allows us to easily create both backcast graphs and forecast traffic using different elasticities of each toll plazas without running an excessive number of regressions. Through this, modellers have a more concise, organised, and time-efficient way of analysing historical traffic segments, presenting regression results, and forecasting traffic trends.
As an economist by background, I might be slightly biased to preferring the use of statistical software over statistical plug ins to Excel that can get the job done when its simple enough but have serious limitations in dealing with more complex statistical analyses. At Infrata, we aim to solve complex problems in the most efficient and cost-effective way, in order to deliver the best possible product to our clients. This is achieved through critical thinking via collaborative discussions and the adoption of what we deem the most optimal tools for the job. This involves constantly evolving and developing different ways to contribute both by staying up to date with industry trends as well as simultaneously integrating more advanced software into our practice.